

Step 1: Install the OpenTelemetry extension
opentelemetry extension is properly installed and enabled:
php.ini file and make sure a line is added similar to this:
Terminal
Step 2: Install the OpenTelemetry SDK
Terminal
Step 3: Initialize the instrumentation
This example shows all the code you will need to add to yourindex.php.
Notice the ChecklySampler class. This is a custom, head-based sampler that will only sample spans that are generated
by Checkly by inspecting the trace state. This way you only pay for the egress traffic generated by Checkly and not for
any other traffic.
index.php
Step 3: Start your app with the instrumentation
Toggle on Import Traces and grab your OTel API key in the OTel API keys section of the Traces page in the Checkly app and take a note of the endpoint for the region you want to use.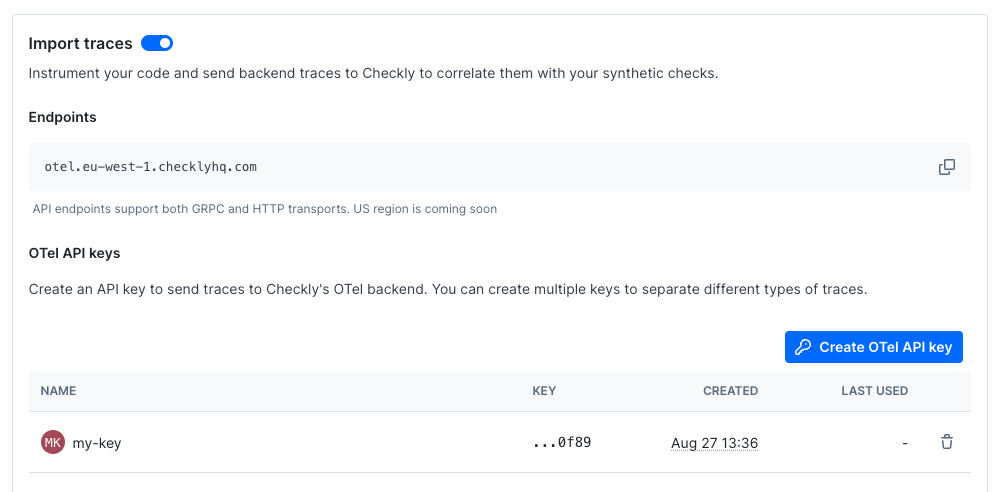
OTEL_EXPORTER_OTLP_HEADERS environment variable.
Terminal
Terminal
Terminal
Finally, start your app:
Terminal