

Each
checkly_check metric has the following labels:
check_name, the name of your check.check_type, eitherapiorbrowser.tags, this check’s tags.
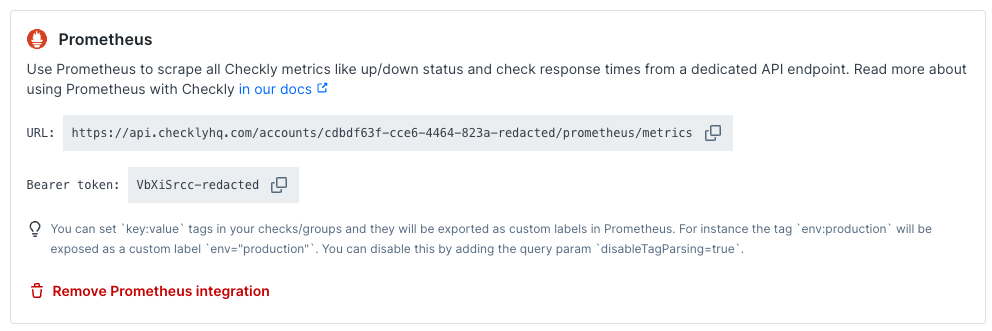
You can setThekey:valuetags in your checks/groups and they will be exported as custom labels in Prometheus. For instance the tagenv:productionwill be exposed as a custom labelenv="production". You can disable this by adding the query paramdisableTagParsing=true.
checkly_private_location metrics contain the labels:
private_location_name, the name of the private location.private_location_slug_name, the private location’s human readable unique identifier.private_location_id, the private location’s UUID.
If a private location has no check runs for six hours, it will be considered inactive and checkly_private_location metrics won’t be reported for it.
Here is an example:
- The check for “Email login” is failing.
- The check for “Customer API” is degraded, but not failing.
- The
checkly_check_statusmetric hasmutedandactivatedlabels, reflecting if a check is sending out alerts or is actually running. - The
checkly_check_resultmetric has aregionlabel. - The private location “Internal CI” has one Checkly Agent connected. From
checkly_private_location_queue_sizeandcheckly_private_location_oldest_scheduled_check_run, we see that there’s no backlog of check run jobs.
-
Navigate to the integrations tab on the account screen and click the ‘Create Prometheus endpoint’ button.

-
We directly create an endpoint for you and provide its URL and the required Bearer token.
-
Create a new job in your Prometheus
prometheus.ymlconfig and set up a scraping interval. We recommend an interval between 30 seconds and 60 seconds. Add the URL (divided intometrics_path,schemeandtarget) andbearer_token. Here is an example
💡 Check out our blog post on using this integration with Prometheus and Grafana for some cool real-life applications.