> ## Documentation Index
> Fetch the complete documentation index at: https://checkly-422f444a-docs-vercel-web-analytics.mintlify.site/llms.txt
> Use this file to discover all available pages before exploring further.
# Analytics API
> Query Checkly check metrics with the Analytics API, returning aggregated or raw data points grouped by location or time window for your own reporting tools.
With the Analytics API, you can query all check metrics and report on Checkly data in your preferred reporting tool!
The Analytics APIs allows queries across different dimensions:
* **Aggregated**: get the p99, sum, standard deviation or whatever you like from DNS times for API checks, or First Contentful Paint (FCP) score for Browser checks.
* **Non-aggregated**: Get the raw data points so you can aggregate yourself how you want it.
Use powerful options like `quickRange` to select time window presets like `last30Days` or `lastMonth`, and group results
per `location` or per `pageIndex`. For aggregated queries you can set the `aggregationInterval` to get, for instance, data
aggregated per week over the last 30 days.
Dive straight into the [API reference](/api-reference/analytics/api-checks) or keep reading for more examples!
## Analytics API basics
There are several endpoints, with one for each check or monitor type.
| Endpoint | Description | API Reference |
| ---------------------------------------- | ---------------------------------------------------------------------------------------------- | --------------------------------------------------------------------------- |
| `/v1/analytics/metrics/` | Returns all the available metrics for a specific check-type (`API`, `URL`, `TCP` or `BROWSER`) | [Learn more](/api-reference/analytics/list-all-available-reporting-metrics) |
| `/v1/analytics/api-checks/{checkId}` | Returns metrics for API checks | [Learn more](/api-reference/analytics/api-checks) |
| `/v1/analytics/browser-checks/{checkId}` | Returns metrics for Browser checks | [Learn more](/api-reference/analytics/browser-checks) |
| `/v1/analytics/multistep-checks/{id}` | Returns metrics for Multistep checks | [Learn more](/api-reference/analytics/multistep-checks) |
| `/v1/analytics/playwright-checks/{id}` | Returns metrics for Playwright check suites | [Learn more](/api-reference/analytics/playwright-checks) |
| `/v1/analytics/dns/{id}` | Returns metrics for DNS monitors | [Learn more](/api-reference/analytics/dns-monitors) |
| `/v1/analytics/heartbeat-checks/{id}` | Returns metrics for Heartbeat monitors | [Learn more](/api-reference/analytics/heartbeat-checks) |
| `/v1/analytics/tcp-checks/{checkId}` | Returns metrics for TCP monitors | [Learn more](/api-reference/analytics/tcp-checks) |
| `/v1/analytics/url-monitors/{checkId}` | Returns metrics for URL monitors | [Learn more](/api-reference/analytics/url-monitors) |
The specific endpoints per check type return a JSON response that includes a check's attributes, period requested,
grouped `series` and a `metadata` section where you'll have additional information about the metrics to create rich reports.
The example below is from a Browser check that visits three pages in a typical e-commerce flow
* `/login`
* `/cart`
* `/cart/add`
We can query the for this Browser check using a `curl` command like:
```bash theme={null}
curl -x GET https://api.checklyhq.com/v1/analytics/browser-checks/79ad4fe0-589a-4924-a027-d18b12eee9cb?metrics=TTFB_avg,TTFB_p99&groupBy=pageIndex&quickRange=last7Days
```
This command add the following query params:
* `metrics=TTFB_avg,TTFB_p99`: return average and p99 aggregate of the TTFB (Time to First Byte)
* `groupBy=pageIndex`: group by page index, i.e. the pages visited int the Browser check.
* `quickRange=last7Days`: aggregate over the last 7 days.
The response looks as follows 👇
```JSON theme={null}
{
"checkId": "79ad4fe0-589a-4924-a027-d18b12eee9cb",
"name": "Shopping Cart - Add product",
"checkType": "BROWSER",
"activated": true,
"muted": false,
"frequency": 5,
"from": "2023-01-20T12:45:57.494Z",
"to": "2023-01-27T12:45:57.494Z",
"tags": [
"sports"
],
"series": [
{
"pageIndex": 0,
"data": [
{
"pageUrl": "https://mycart.acme.com/login",
"pageIndex": 0,
"responseTime_avg": 7216.8896,
"TTFB_avg": 746.9548609294588,
"TTFB_p99": 1059.7
}
]
},
{
"pageIndex": 1,
"data": [
{
"pageUrl": "https://mycart.acme.com/cart",
"pageIndex": 1,
"responseTime_avg": 7216.8896,
"TTFB_avg": 239.41101193049596,
"TTFB_p99": 310.8
}
]
},
{
"pageIndex": 2,
"data": [
{
"pageUrl": "https://mycart.acme.com/cart/add",
"pageIndex": 2,
"responseTime_avg": 7216.8896,
"TTFB_avg": 1.3732638888888888,
"TTFB_p99": 0
}
]
}
],
"metadata": {
"responseTime_avg": {
"unit": "milliseconds",
"label": "Response time for the full script",
"aggregation": "avg"
},
"TTFB_avg": {
"unit": "milliseconds",
"label": "Time To First Byte",
"aggregation": "avg"
},
"TTFB_p99": {
"unit": "milliseconds",
"label": "Time To First Byte",
"aggregation": "p99"
}
},
"pagination": {
"page": 1,
"limit": 10
}
}
```
## Using the API with Postman
Here you will see an example of a request using [Postman](https://www.postman.com/) where the `/v1/analytics/browser-check` endpoint returns aggregated
data (`TTFB_p50` and `TTFB_p90`) for the last 7 days grouping by page.
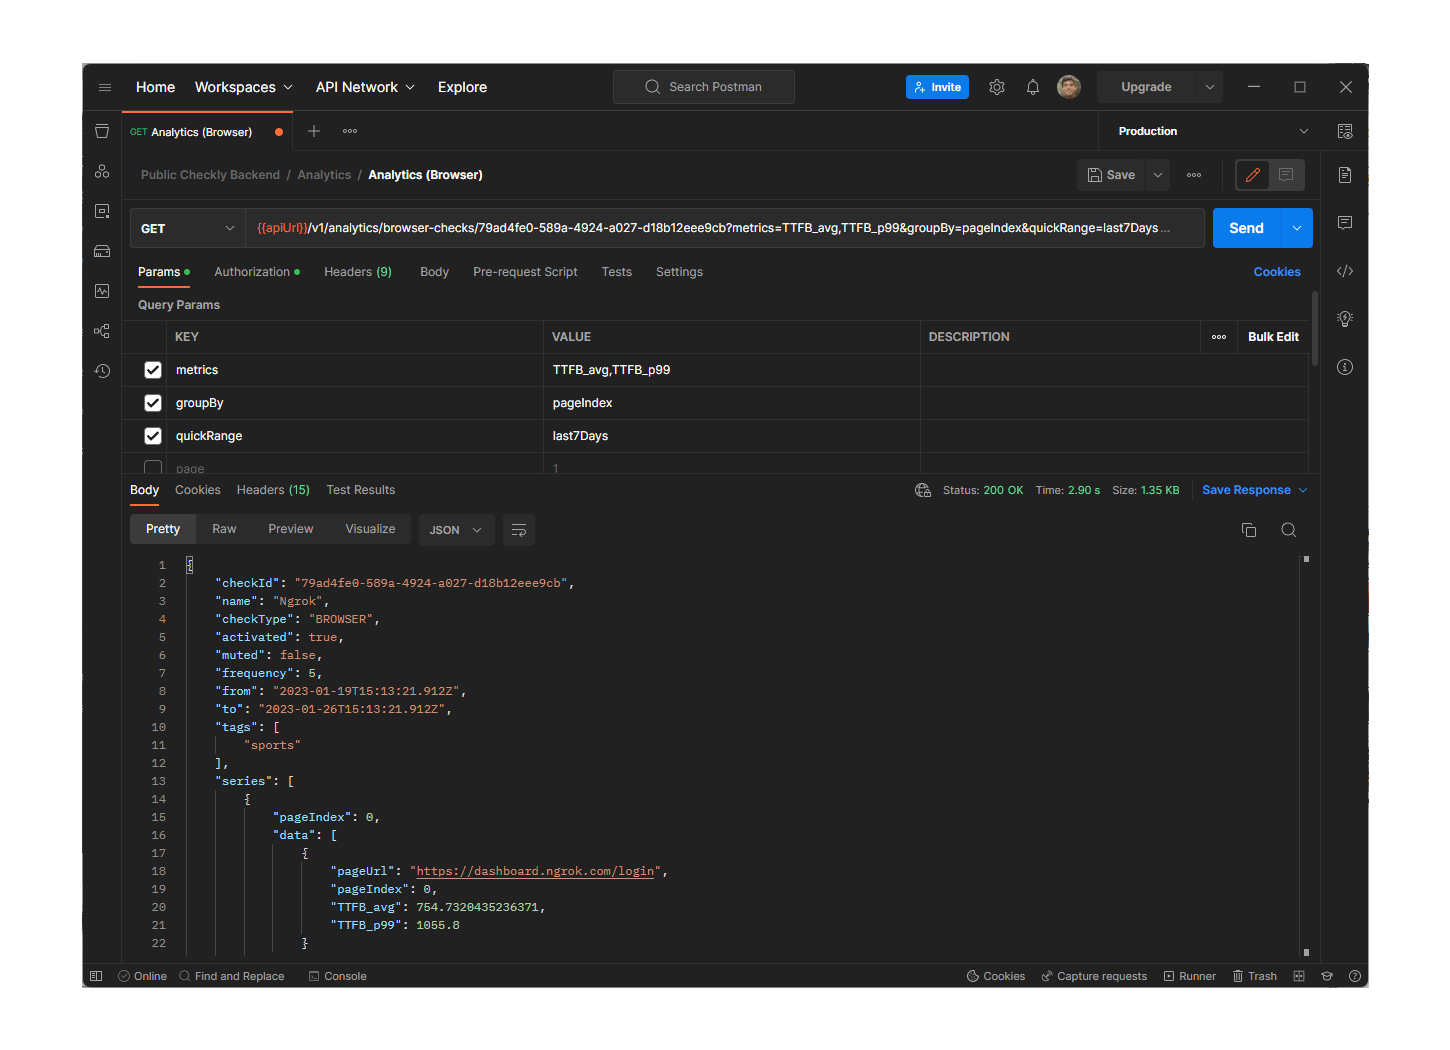 > You **must** add the `X-Checkly-Account` and `Authorization` headers to authenticate.
## Creating a Grafana Dashboard
Following these instructions you'll learn how to use the Analytics API within a [Grafana](https://grafana.com/) dashboard:
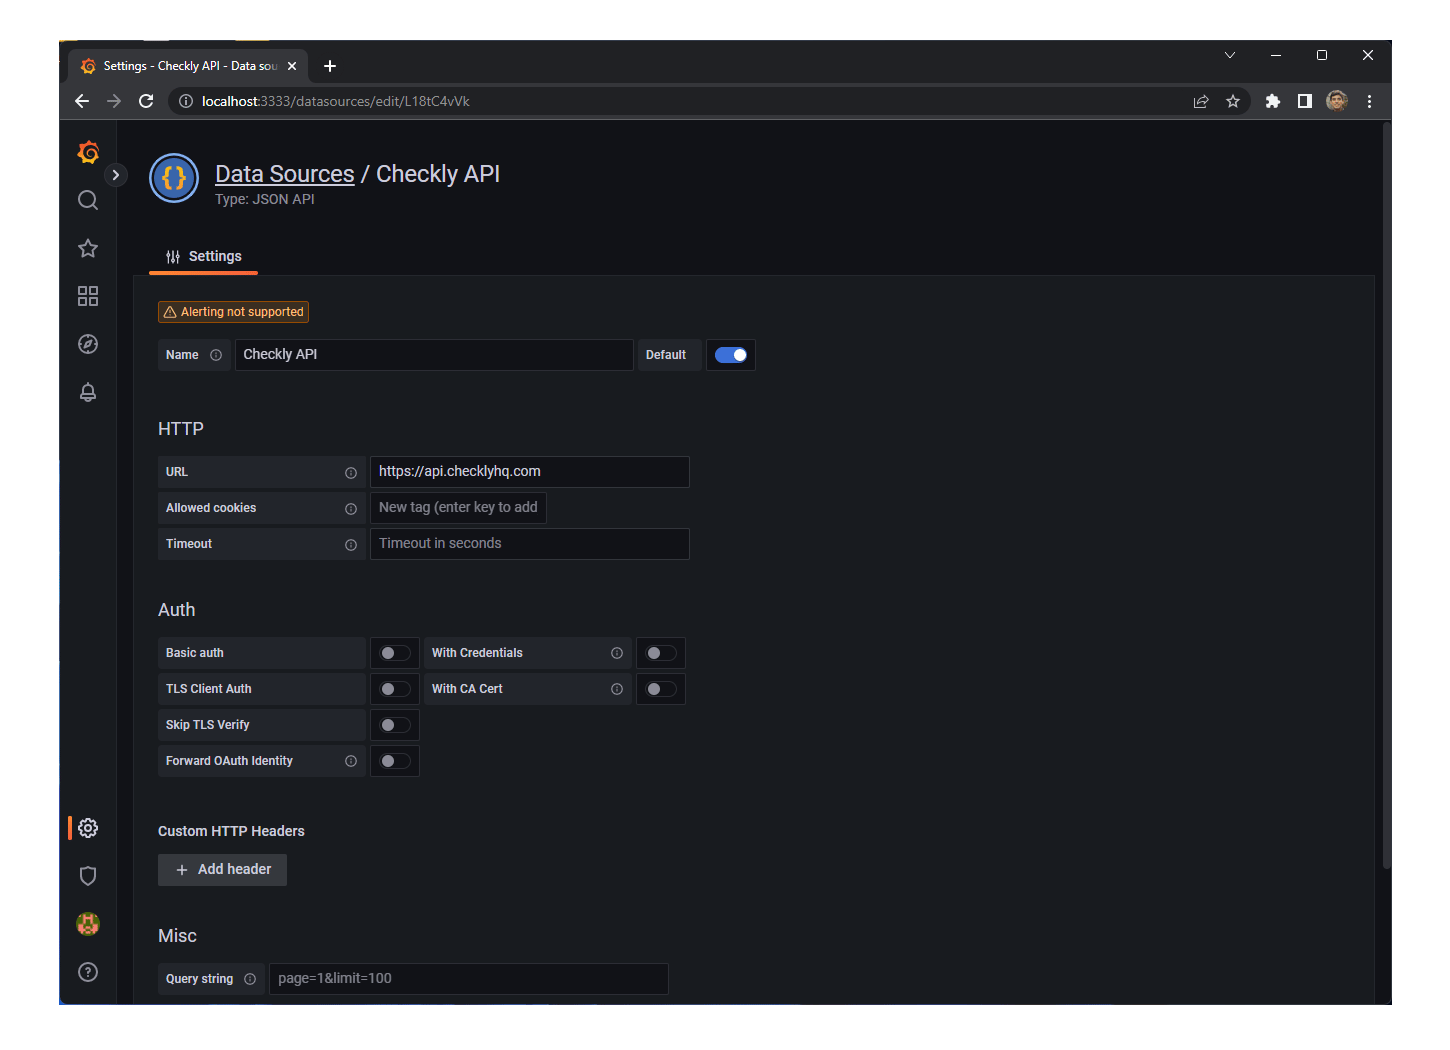
1. Creating the Data Source
First, you need to create the Data Source with the Analytics API connection. After installing the [JSON API](https://grafana.com/grafana/plugins/marcusolsson-json-datasource/) plugin you'll be able to consume any REST API and handle JSON responses.
> You **must** add the `X-Checkly-Account` and `Authorization` headers to authenticate.
## Creating a Grafana Dashboard
Following these instructions you'll learn how to use the Analytics API within a [Grafana](https://grafana.com/) dashboard:
1. Creating the Data Source
First, you need to create the Data Source with the Analytics API connection. After installing the [JSON API](https://grafana.com/grafana/plugins/marcusolsson-json-datasource/) plugin you'll be able to consume any REST API and handle JSON responses.
 2. Configuring a component
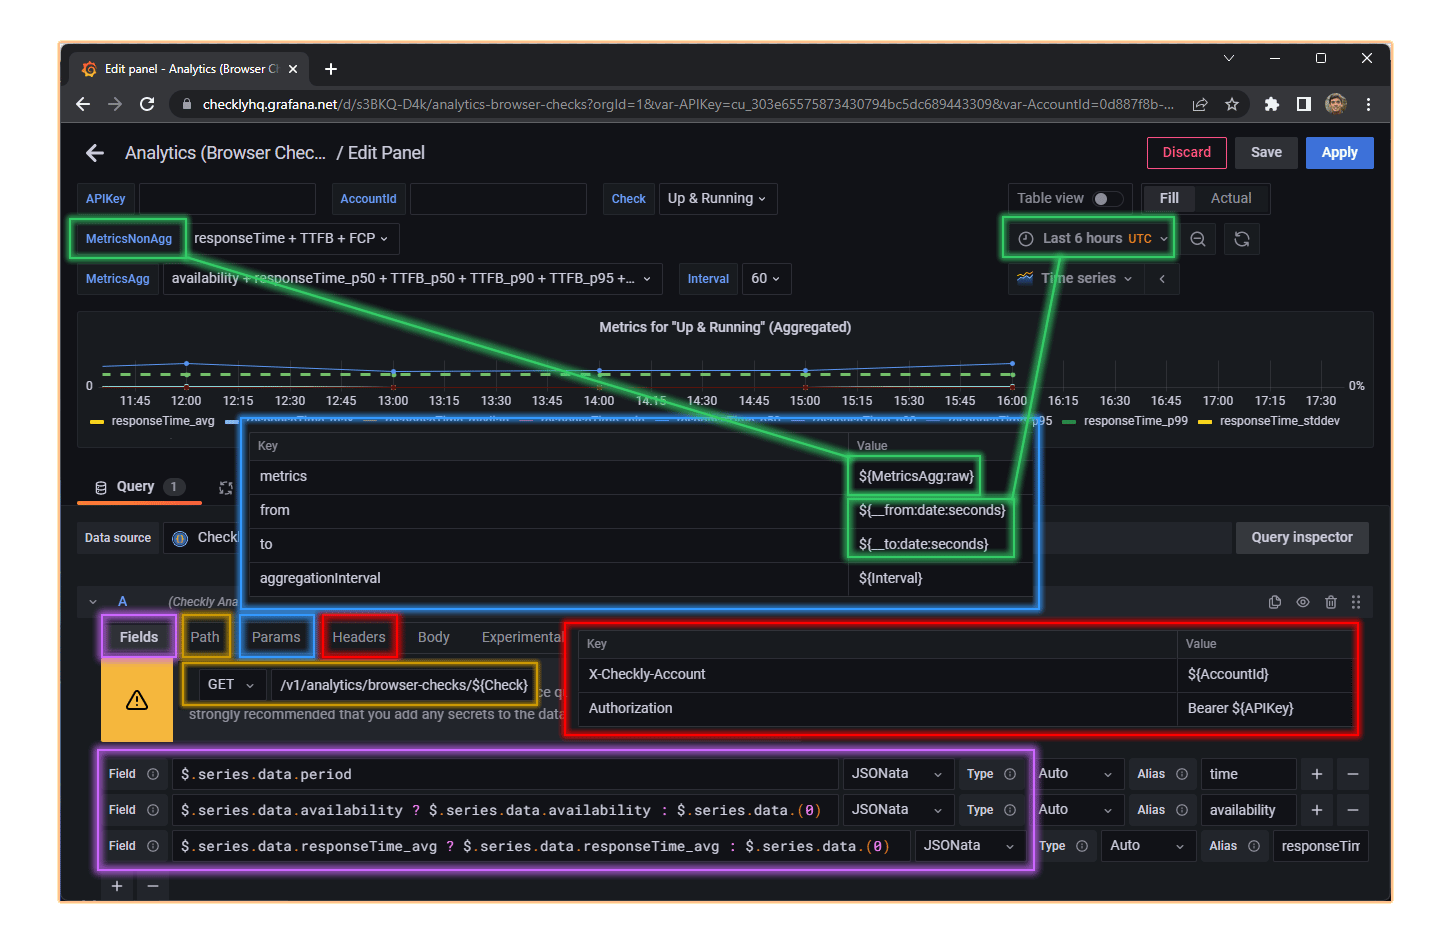
Next, you can pick a **time series** component and configure it by selecting the `Checkly Analytics API` data source and
setting the required HTTP header and query parameters to fetch the JSON. You'll find detailed docs on available parameters in the [API docs](/api-reference/analytics/api-checks)
In the following image you'll see all required configuration for a component:
* `Fields`
* `Path`
* `Query parameters`
* `Header`
* `Variables` (optional)
2. Configuring a component
Next, you can pick a **time series** component and configure it by selecting the `Checkly Analytics API` data source and
setting the required HTTP header and query parameters to fetch the JSON. You'll find detailed docs on available parameters in the [API docs](/api-reference/analytics/api-checks)
In the following image you'll see all required configuration for a component:
* `Fields`
* `Path`
* `Query parameters`
* `Header`
* `Variables` (optional)
 1. Designing the dashboard
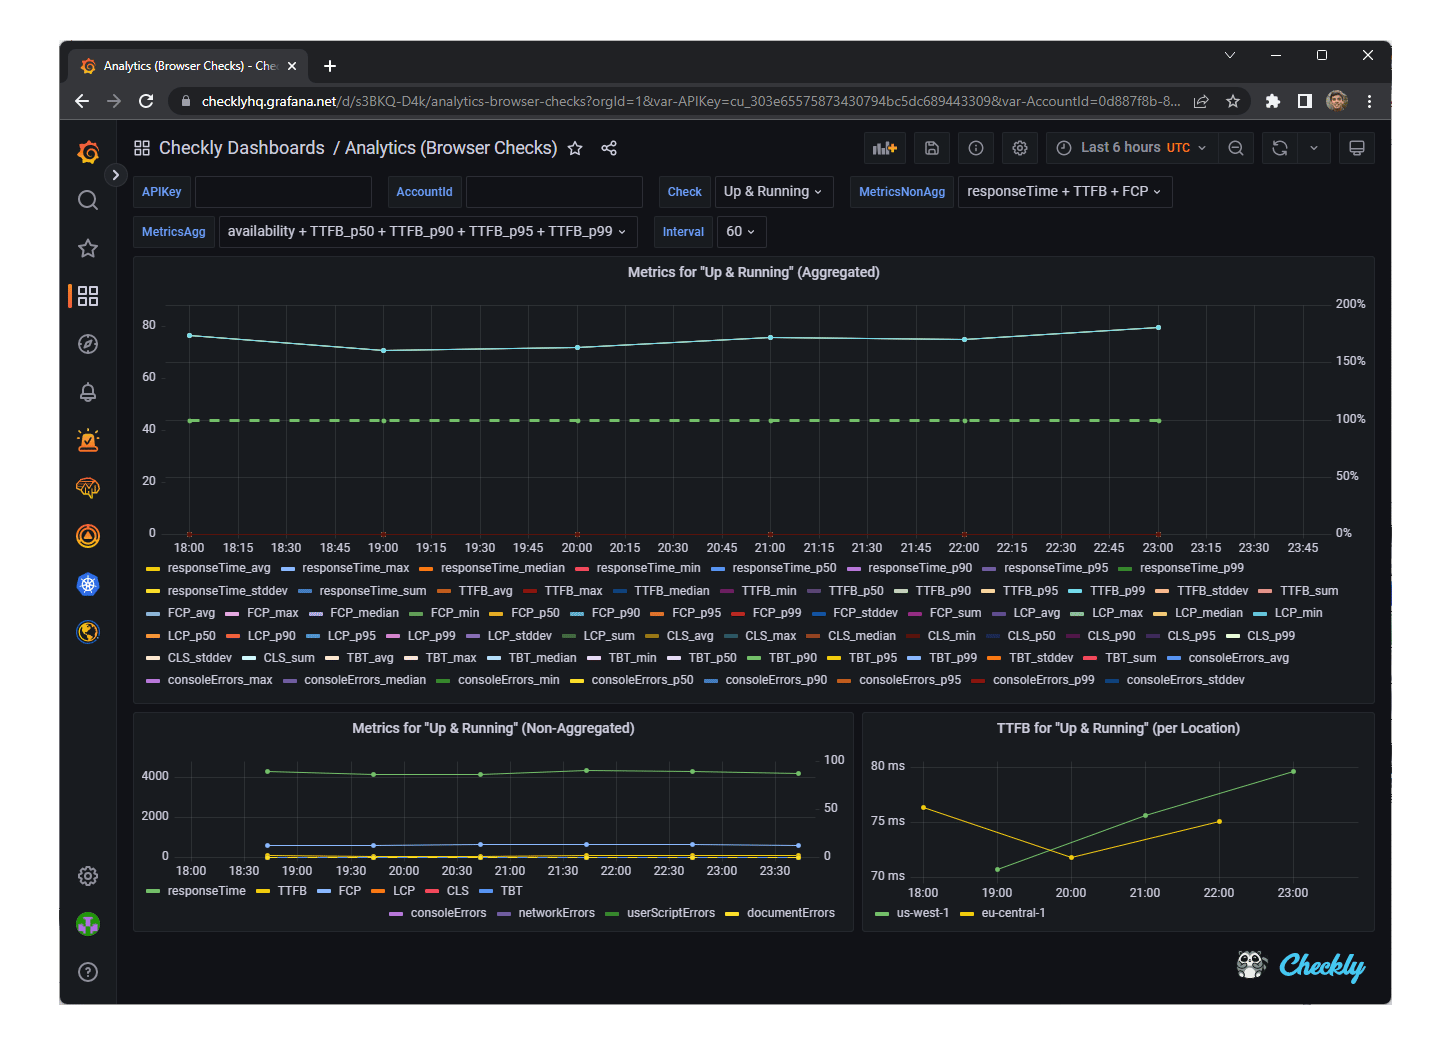
You can mix multiple components to create a beautiful dashboard. The following screenshot shows a dashboard with three types of results:
* aggregated
* non-aggregated
* and summarized grouped by location.
1. Designing the dashboard
You can mix multiple components to create a beautiful dashboard. The following screenshot shows a dashboard with three types of results:
* aggregated
* non-aggregated
* and summarized grouped by location.
 ## Creating reports with Google Sheets
You can start creating your reports by using our public Google Sheets report example template. The spreadsheet includes the `=ChecklyAPI()` function to consume the Checkly Public API just entering configuring your credentials.
1. Make a copy of our [public Google Sheets template](https://docs.google.com/spreadsheets/d/1ChcFMzuO2LOJVqu7kLGjqXf-0WmnD49_ghRLmm-OQAc/edit#gid=747858019).
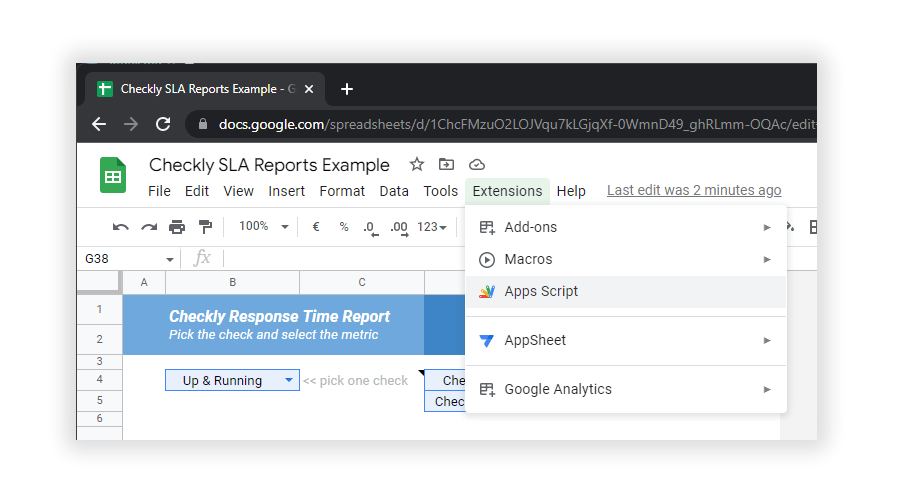
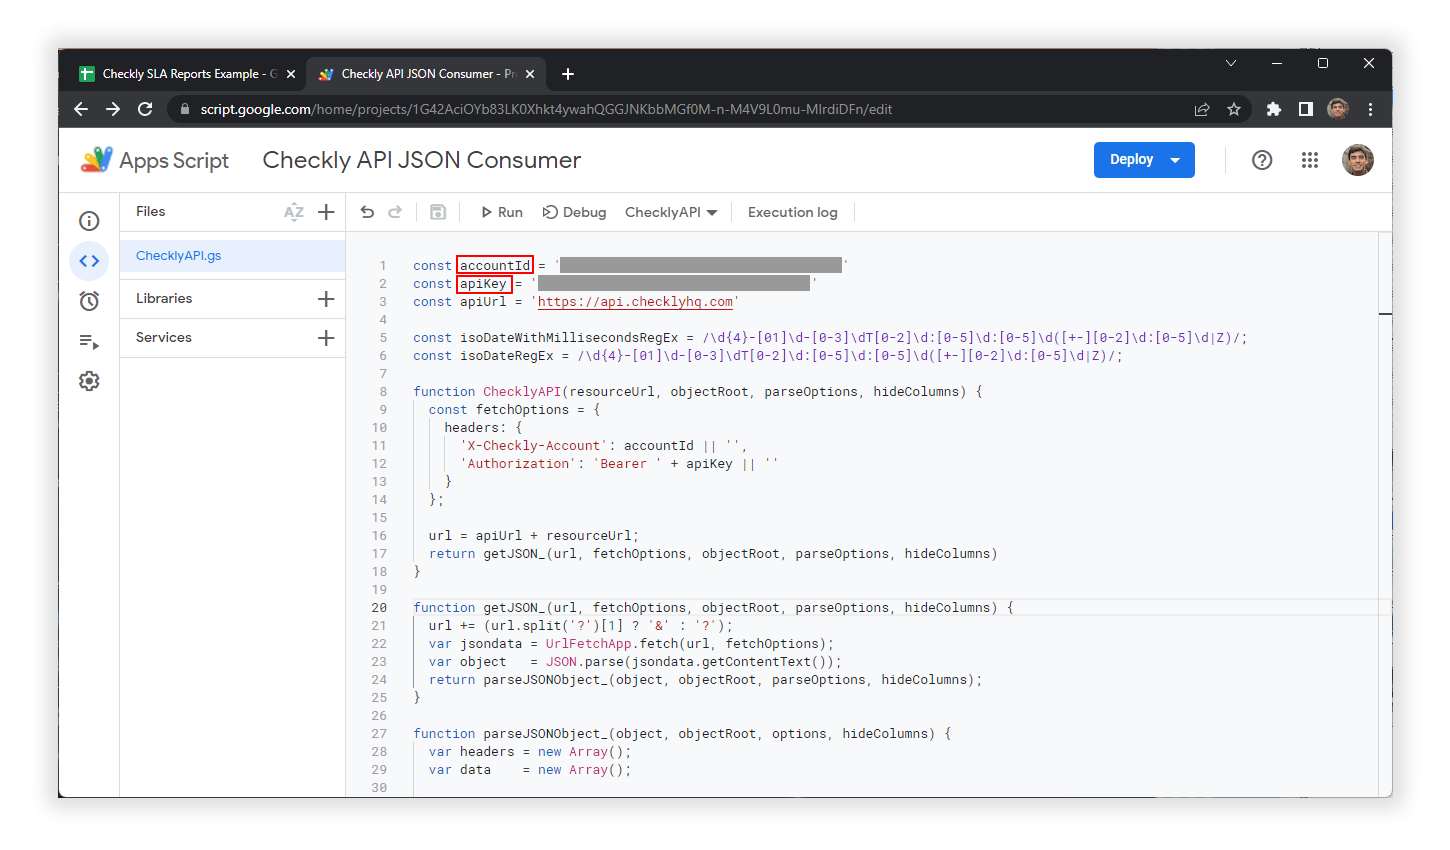
2. Add your `Account Id` and `API Key` in the Apps Script code (be careful if you'll share your spreadsheet with your credentials)
## Creating reports with Google Sheets
You can start creating your reports by using our public Google Sheets report example template. The spreadsheet includes the `=ChecklyAPI()` function to consume the Checkly Public API just entering configuring your credentials.
1. Make a copy of our [public Google Sheets template](https://docs.google.com/spreadsheets/d/1ChcFMzuO2LOJVqu7kLGjqXf-0WmnD49_ghRLmm-OQAc/edit#gid=747858019).
2. Add your `Account Id` and `API Key` in the Apps Script code (be careful if you'll share your spreadsheet with your credentials)
 3. Navigate the `Metrics` and `Checks` pages to confirm `Checkly Public API` requests are working
4. Go to the `Analytics Report` page, pick a check, pick a metric and see if the chart shows the correct information
3. Navigate the `Metrics` and `Checks` pages to confirm `Checkly Public API` requests are working
4. Go to the `Analytics Report` page, pick a check, pick a metric and see if the chart shows the correct information
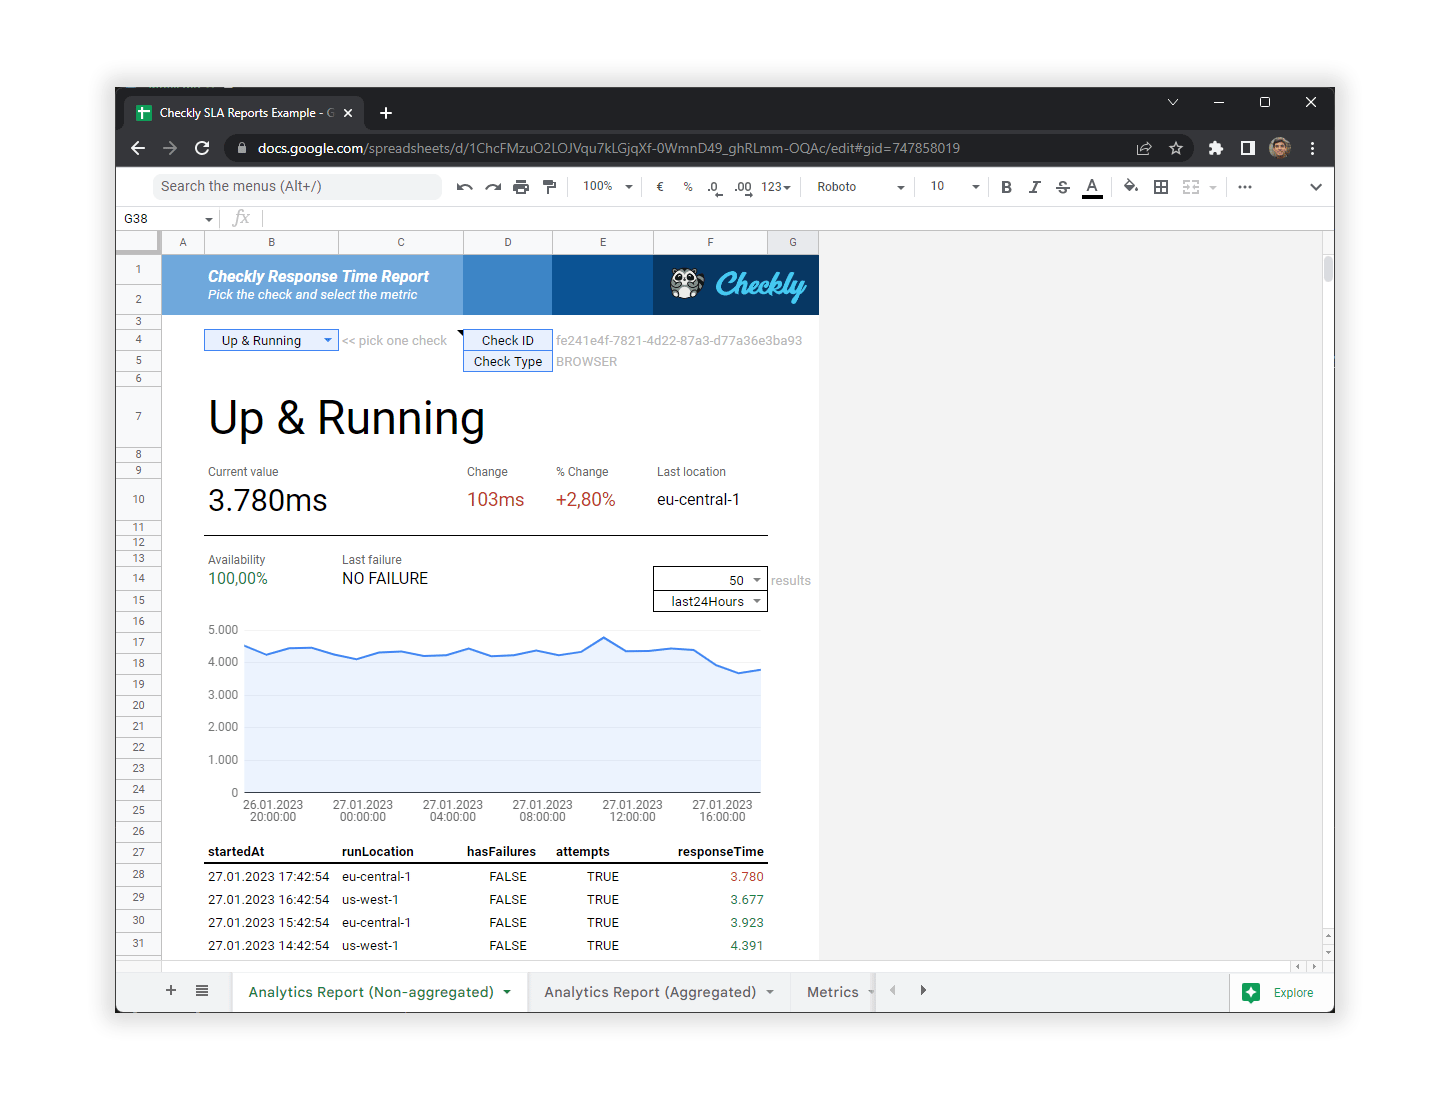
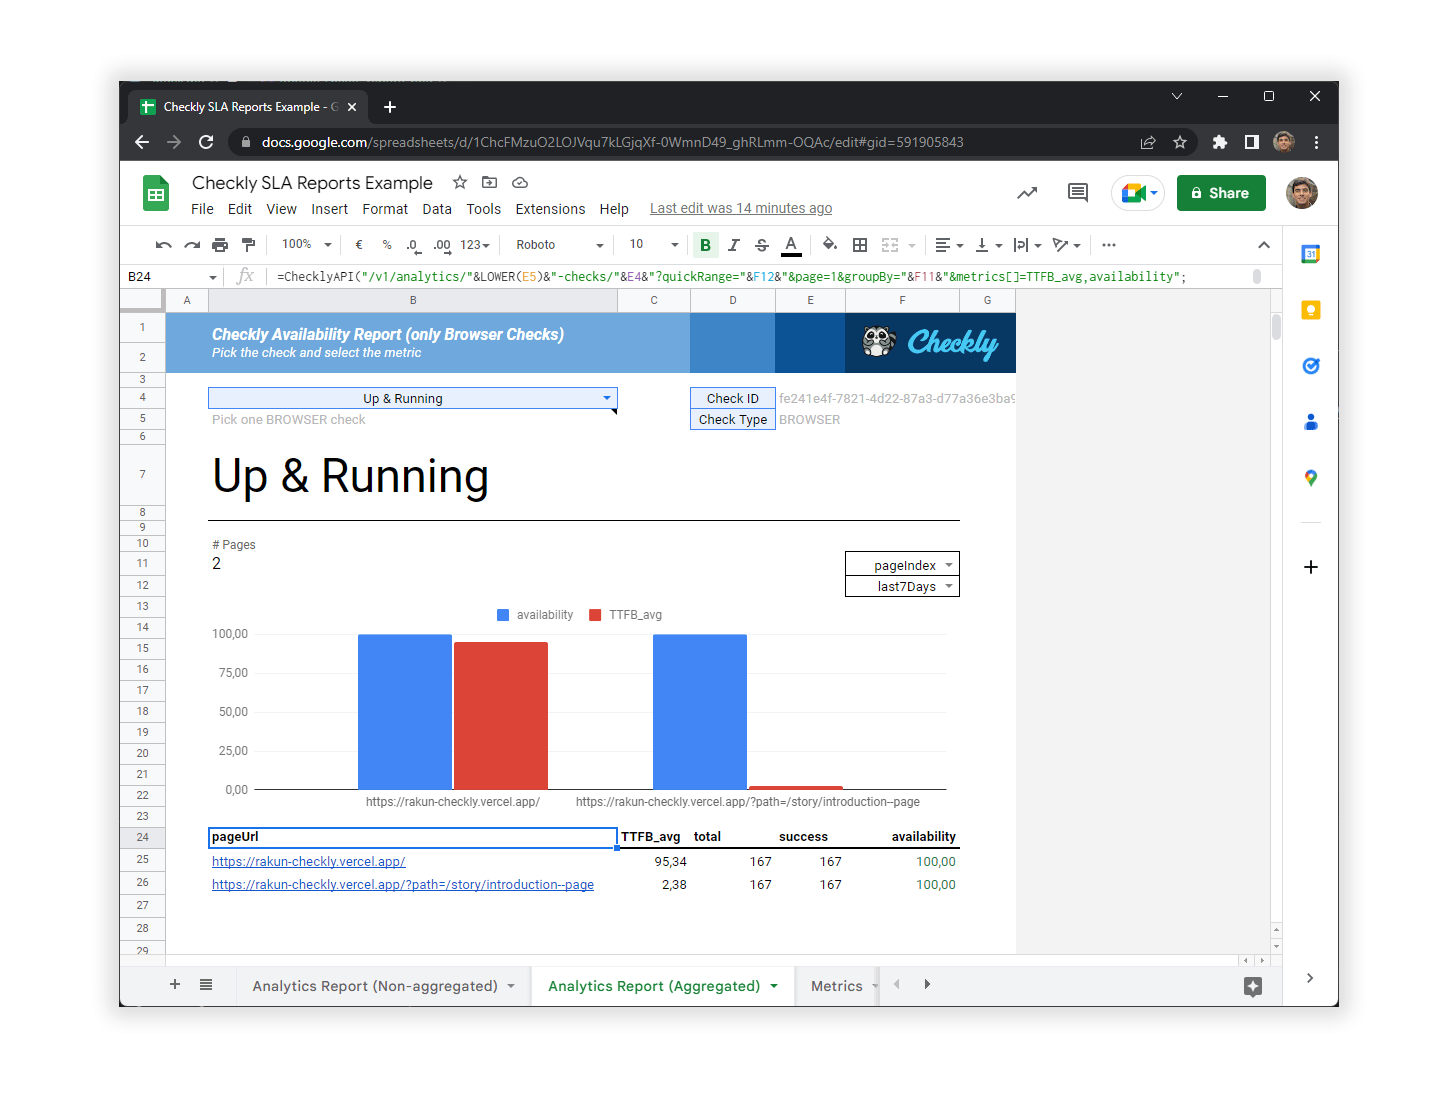 You'll find dropdown cells to select the check, number of results, quick time range presets, or grouping attribute.
## Creating report using `curl` and `jq`
You can even whip up a `bash` script and use `curl` and `jq` to print useful analytics to your terminal. Here is an example
script that does the following:
1. It fetches your checks from the `/v1/checks` endpoint.
2. Loops over your checks and based on the check type, calls the `v1/analytics/` endpoint to gather useful data.
```bash theme={null}
#!
ACCOUNT_ID=
TOKEN=
rawChecks=$(curl -s --request GET \
--url 'https://api-test.checklyhq.com/v1/checks?limit=5&page=1' \
--header "Authorization: Bearer ${TOKEN}" \
--header "X-Checkly-Account: ${ACCOUNT_ID}")
checksAndTypes=$(jq -c 'sort_by(.checkType) | [.[] | {id, checkType}]' <<< "${rawChecks}" )
printf '\n'
for row in $(echo "${checksAndTypes}" | jq -c '.[]'); do
checkType=$(jq -r '.checkType' <<< "${row}")
checkId=$(jq -r '.id' <<< "${row}")
case $checkType in
BROWSER)
rawMetric=$(curl -s --request GET \
--url "https://api-test.checklyhq.com/v1/analytics/browser-checks/${checkId}?metrics%5B%5D=TTFB_p99&metrics%5B%5D=FCP_p99&metrics%5B%5D=consoleErrors_sum&metrics%5B%5D=availability&quickRange=last30Days" \
--header "Authorization: Bearer ${TOKEN}" \
--header "X-Checkly-Account: ${ACCOUNT_ID}")
jq -jr '.checkType, " - ", .name' <<< "${rawMetric}"
printf '\n'
jq -r '"availability\tTTFB\tFCP\tErrors", "--------------\t---\t---\t------", (.series[0].data[]| "\(.availability)\t\(.TTFB_p99)\t\(.FCP_p99)\t\(.consoleErrors_sum)")' <<< "${rawMetric}" | column -t -s $'\t'
;;
API)
rawMetric=$(curl -s --request GET \
--url "https://api-test.checklyhq.com/v1/analytics/api-checks/${checkId}?metrics%5B%5D=firstByte_p99&metrics%5B%5D=availability&metrics%5B%5D=dns_p99" \
--header "Authorization: Bearer ${TOKEN}" \
--header "X-Checkly-Account: ${ACCOUNT_ID}")
jq -jr '.checkType, " - ", .name' <<< "${rawMetric}"
printf '\n'
jq -r '"Availability\tTTFB\tDNS", "--------------\t----\t---", (.series[0].data[]| "\(.availability)\t\(.firstByte_p99)\t\(.dns_p99)")' <<< "${rawMetric}" | column -t -s $'\t'
;;
*)
echo -n "unknown"
;;
esac
printf '%.0s\n' {1..2}
done
```
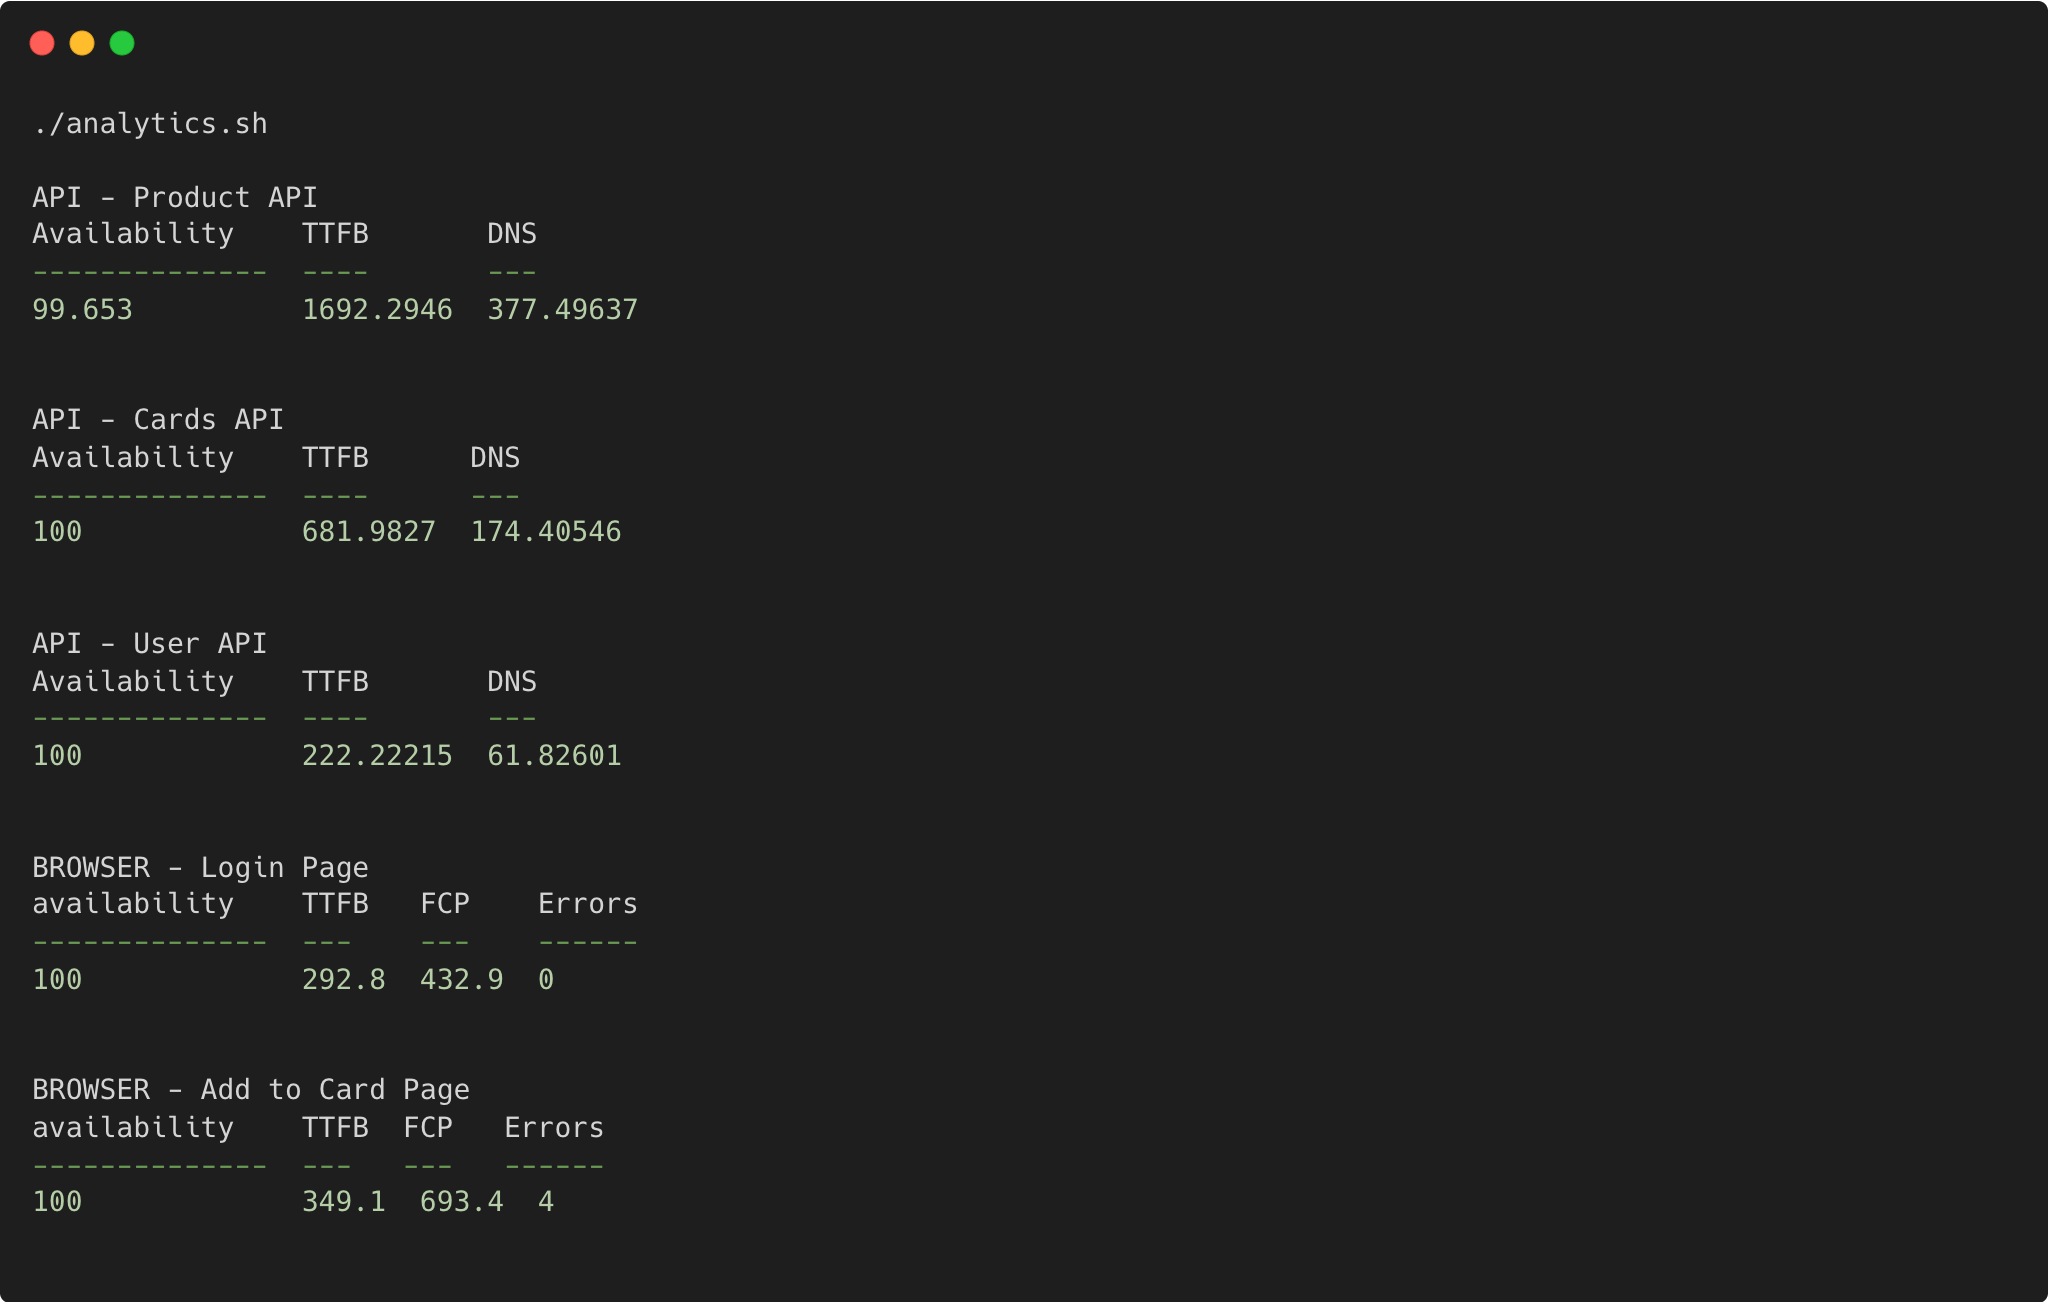
Save this script in a file called `analytics.sh` and run it. You will get an output similar to:
You'll find dropdown cells to select the check, number of results, quick time range presets, or grouping attribute.
## Creating report using `curl` and `jq`
You can even whip up a `bash` script and use `curl` and `jq` to print useful analytics to your terminal. Here is an example
script that does the following:
1. It fetches your checks from the `/v1/checks` endpoint.
2. Loops over your checks and based on the check type, calls the `v1/analytics/` endpoint to gather useful data.
```bash theme={null}
#!
ACCOUNT_ID=
TOKEN=
rawChecks=$(curl -s --request GET \
--url 'https://api-test.checklyhq.com/v1/checks?limit=5&page=1' \
--header "Authorization: Bearer ${TOKEN}" \
--header "X-Checkly-Account: ${ACCOUNT_ID}")
checksAndTypes=$(jq -c 'sort_by(.checkType) | [.[] | {id, checkType}]' <<< "${rawChecks}" )
printf '\n'
for row in $(echo "${checksAndTypes}" | jq -c '.[]'); do
checkType=$(jq -r '.checkType' <<< "${row}")
checkId=$(jq -r '.id' <<< "${row}")
case $checkType in
BROWSER)
rawMetric=$(curl -s --request GET \
--url "https://api-test.checklyhq.com/v1/analytics/browser-checks/${checkId}?metrics%5B%5D=TTFB_p99&metrics%5B%5D=FCP_p99&metrics%5B%5D=consoleErrors_sum&metrics%5B%5D=availability&quickRange=last30Days" \
--header "Authorization: Bearer ${TOKEN}" \
--header "X-Checkly-Account: ${ACCOUNT_ID}")
jq -jr '.checkType, " - ", .name' <<< "${rawMetric}"
printf '\n'
jq -r '"availability\tTTFB\tFCP\tErrors", "--------------\t---\t---\t------", (.series[0].data[]| "\(.availability)\t\(.TTFB_p99)\t\(.FCP_p99)\t\(.consoleErrors_sum)")' <<< "${rawMetric}" | column -t -s $'\t'
;;
API)
rawMetric=$(curl -s --request GET \
--url "https://api-test.checklyhq.com/v1/analytics/api-checks/${checkId}?metrics%5B%5D=firstByte_p99&metrics%5B%5D=availability&metrics%5B%5D=dns_p99" \
--header "Authorization: Bearer ${TOKEN}" \
--header "X-Checkly-Account: ${ACCOUNT_ID}")
jq -jr '.checkType, " - ", .name' <<< "${rawMetric}"
printf '\n'
jq -r '"Availability\tTTFB\tDNS", "--------------\t----\t---", (.series[0].data[]| "\(.availability)\t\(.firstByte_p99)\t\(.dns_p99)")' <<< "${rawMetric}" | column -t -s $'\t'
;;
*)
echo -n "unknown"
;;
esac
printf '%.0s\n' {1..2}
done
```
Save this script in a file called `analytics.sh` and run it. You will get an output similar to: